 |
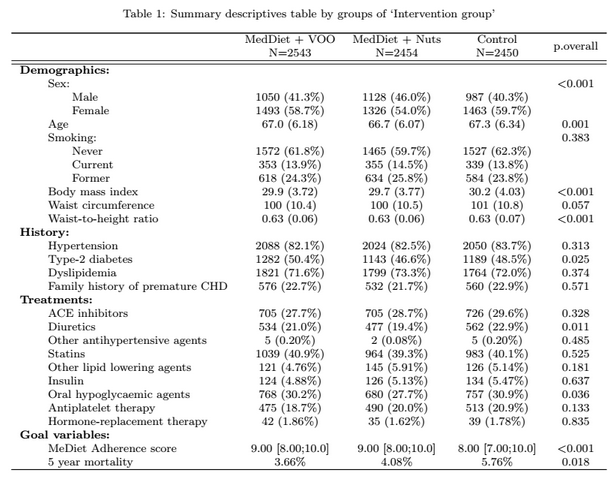
Produce ready to publish descriptive tablesDescriptives tables can be written on several type of files: PDF, csv, Word, Excel, LaTeX, or directly on R console in a nice format. |
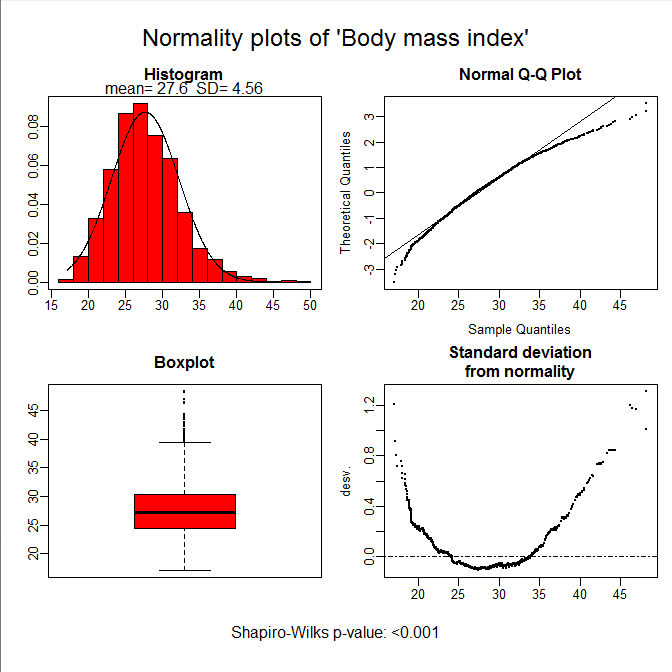 |
Explore your data visuallyExamine how your data looks like, variable by variable, to find out possible outliers, check if it follows a normal distribution, etc. |
Download compareGroups from CRANUse the most powerful way to construct bivariate table with R. |
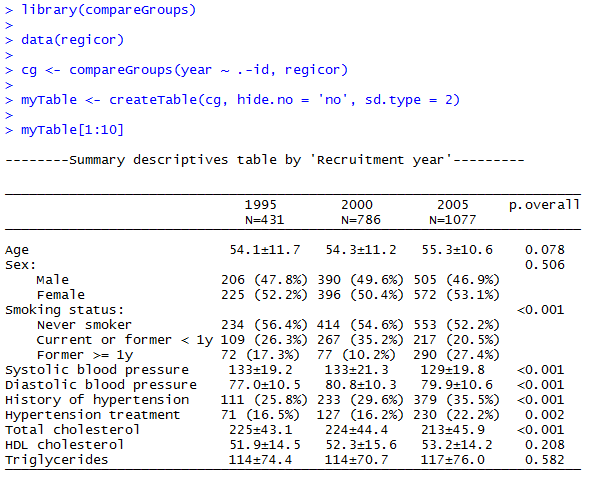 |
Use compareGroups from R consoleBuild descriptive tables by typing simple code.Also, take the advantage of R to modifiy the output easily, or costumize the tables thanks to the many options incorporated in the compareGroups functions package. |
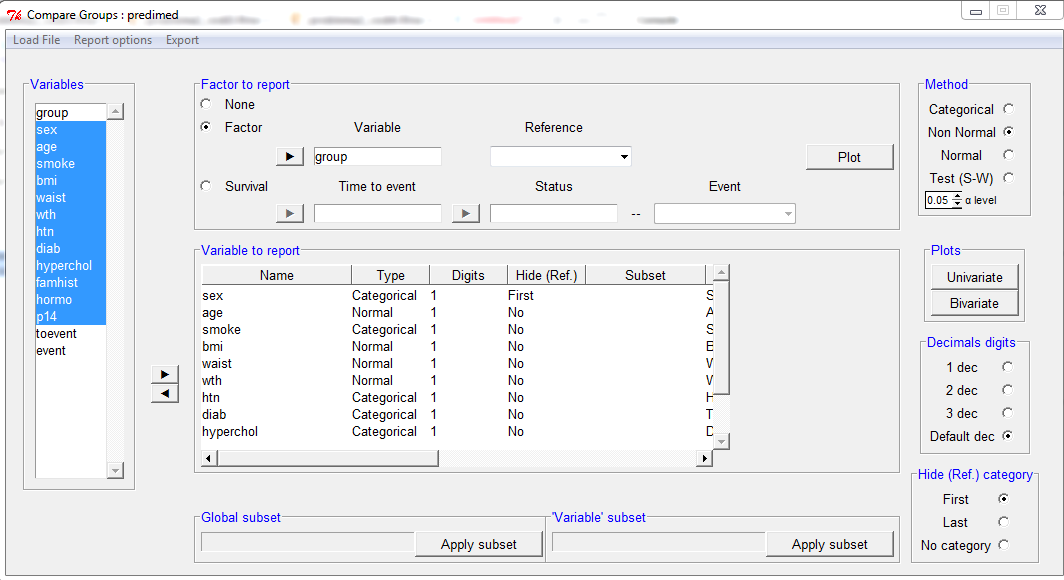 |
Use compareGroups from a GUIFor those interested in using compareGroups from R but not so familiar with 'typing' R code, there is graphical user interface (GUI) with an aspect similar to R-commander. |
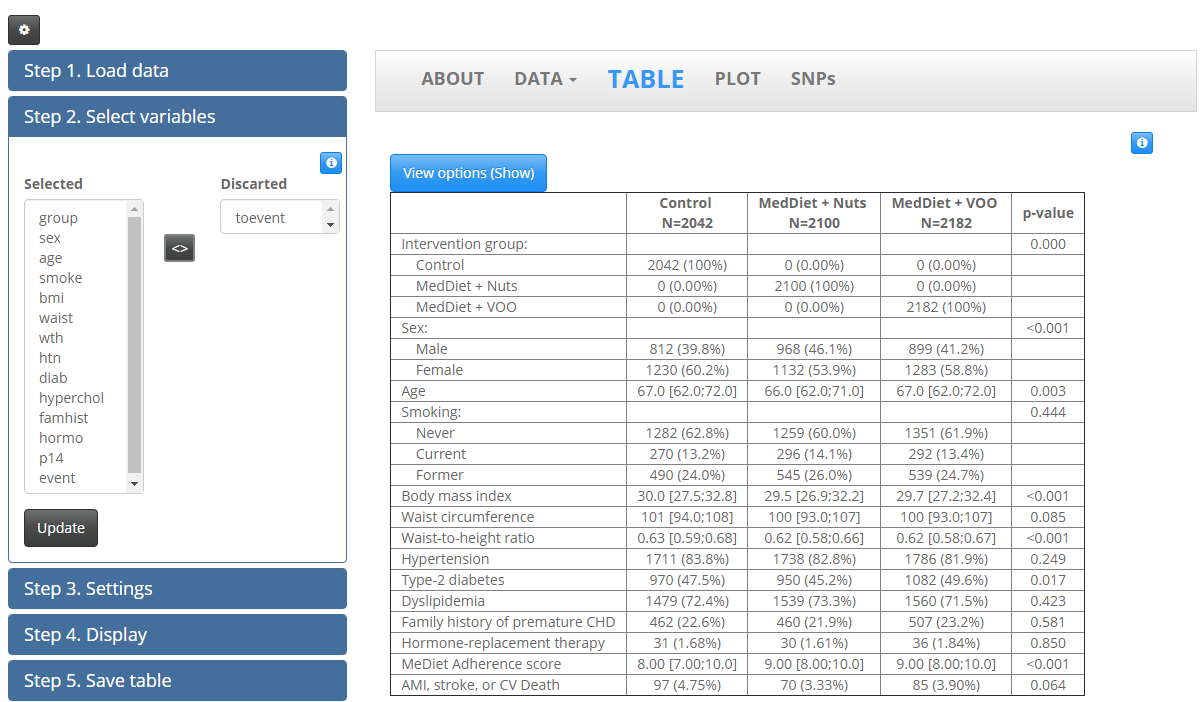 |
Use compareGroups by a remote web GUIDo you want to use compareGroups without having R installed in your computer, or even from a tablet or a smartphone? This is possible by the Web User Interface (WUI) constructed making use of Shiny package tools. |